簡単に機械学習を実装できるMediaPipeをgoogleが公開しています。
機械学習のライブラリは年々増えてきて、何を使うか悩んでしまいますね。実装の手軽さという点で優れているのが、googleのMediaPipeです。
手軽に、スマホやPCのカメラと連携して「画像認識」「物体検知」「セグメンテーション」ができてしまいます。今回は、MediaPipeの中で、「画像認識」のサンプルコードを解説します。初心者向けになります。
はじめに
今回説明するサンプルコードは、学習済みの画像認識モデルを使って、手持ちの画像データを分類するコードです。非常に軽量なモデルをつかっているため、GPUなしでも、実用的なスピードで動作します。
サンプルコードはこちらです。

サンプルコード解説
準備
!python -m pip install mediapipemediapipeをインストールします。コマンドラインで実行するときは”!”抜きましょう。
!wget -O classifier.tflite -q https://storage.googleapis.com/mediapipe-models/image_classifier/efficientnet_lite0/float32/1/efficientnet_lite0.tflite学習済みのモデルをwebページからダウンロードします。コマンドラインで実行するときは”!”抜きましょう。
Efficientnetの軽量モデルですね。
インポート
import mediapipe as mp
from mediapipe.tasks import python
from mediapipe.tasks.python import vision
はじめに、mediapipeの各種ライブラリをインポートします
画像表示関連の関数
少し長いので初心者のかたは読み飛ばしてもOKです。本題のとことではないです。。。
from matplotlib import pyplot as plt
plt.rcParams.update({
    'axes.spines.top': False,
    'axes.spines.right': False,
    'axes.spines.left': False,
    'axes.spines.bottom': False,
    'xtick.labelbottom': False,
    'xtick.bottom': False,
    'ytick.labelleft': False,
    'ytick.left': False,
    'xtick.labeltop': False,
    'xtick.top': False,
    'ytick.labelright': False,
    'ytick.right': False
})


def display_one_image(image, title, subplot, titlesize=16):
    """Displays one image along with the predicted category name and score."""
    plt.subplot(*subplot)
    plt.imshow(image)
    if len(title) > 0:
        plt.title(title, fontsize=int(titlesize), color='black', fontdict={'verticalalignment':'center'}, pad=int(titlesize/1.5))
    return (subplot[0], subplot[1], subplot[2]+1)

def display_batch_of_images(images, predictions):
    """Displays a batch of images with the classifications."""
    # Images and predictions.
    images = [image.numpy_view() for image in images]

    # Auto-squaring: this will drop data that does not fit into square or square-ish rectangle.
    rows = int(math.sqrt(len(images)))
    cols = len(images) // rows

    # Size and spacing.
    FIGSIZE = 13.0
    SPACING = 0.1
    subplot=(rows,cols, 1)
    if rows < cols:
        plt.figure(figsize=(FIGSIZE,FIGSIZE/cols*rows))
    else:
        plt.figure(figsize=(FIGSIZE/rows*cols,FIGSIZE))

    # Display.
    for i, (image, prediction) in enumerate(zip(images[:rows*cols], predictions[:rows*cols])):
        dynamic_titlesize = FIGSIZE*SPACING/max(rows,cols) * 40 + 3
        subplot = display_one_image(image, prediction, subplot, titlesize=dynamic_titlesize)

    # Layout.
    plt.tight_layout()
    plt.subplots_adjust(wspace=SPACING, hspace=SPACING)
plt.show()- 1行目:matplotlibをインポート
- 2~15行目:matplotの設定をしています。グラフではなく、画像なので、線などを表示しないようにしています。
- 18~24行目:1枚画像を表示する関数
- 20行目:plt.subplotで画像複数画像描画するときのどこに書くかを指定します
- 21行目:画像表示
- 23行目:タイトルがあるならば
- 24行目:画像にタイトルを書きます
- 25行目:subplotを返します
- 26~52行目:バッチ処理で画像を描画する関数です。中で1枚画像を表示する関数をつかってます。
- 29行目:画像データをnumpy形式に変換。リスト内包表記だと一行で済みますね。
- 32行目:複数画像表示するときの、行数。縦方向に画像何個表示するか。
- 33行目:複数画像表示するときの、列数。横方向に画像何個表示するか。
- 36行目:Figのサイズ
- 37行目:スペースのサイズ
- 38行目:サブプロットの行数、列数を指定しておきます。
- 39行目:行<列数ならば
- 40、42行目:figのサイズ指定
- 45行目:画像のリストと予測結果のリストをfor文で回します
- 46行目:画像のタイトルサイズを指定。subplotの行・列数に合わせて
- 47行目:1枚づつ表示する関数を使って表示
- 50行目:狭い感じのレイアウト
- 51行目:subplotの間隔を設定
- 52行目:表示
テスト画像をダウンロードして用意する場合
import urllib

IMAGE_FILENAMES = ['burger.jpg', 'cat.jpg']

for name in IMAGE_FILENAMES:
  url = f'https://storage.googleapis.com/mediapipe-tasks/image_classifier/{name}'
  urllib.request.urlretrieve(url, name)
なんでもいいのですが、テスト用の画像を準備します。上の例では、ハンバーガと猫の画像をダウンロードしています。(ここは本題ではないので、あまり説明しないです。。。)
テスト画像を自分で用意して、colabにアップロードする場合
from google.colab import files
uploaded = files.upload()

for filename in uploaded:
   content = uploaded[filename]
   with open(filename, 'wb') as f:
     f.write(content)
 IMAGE_FILENAMES = list(uploaded.keys())

print('Uploaded files:', IMAGE_FILENAMES)- 1行目:colabのライブラリをインポート
- 2行目:ファイルをアップロードするオブジェクト
- 4行目:ファイルの数だけfor分回す
- 6行目:元々のファイル名のまま保存します。colabのrootディレクトリに
- 7行目:ファイル保存します
- 8行目:ファイル名のリスト作成
- 10行目:ファイル名を表示
テスト画像を表示して確認
import cv2
from google.colab.patches import cv2_imshow
import math

DESIRED_HEIGHT = 480
DESIRED_WIDTH = 480

def resize_and_show(image):
  h, w = image.shape[:2]
  if h < w:
    img = cv2.resize(image, (DESIRED_WIDTH, math.floor(h/(w/DESIRED_WIDTH))))
  else:
    img = cv2.resize(image, (math.floor(w/(h/DESIRED_HEIGHT)), DESIRED_HEIGHT))
  cv2_imshow(img)


# Preview the images.

images = {name: cv2.imread(name) for name in IMAGE_FILENAMES}
for name, image in images.items():
  print(name)
resize_and_show(image)- 1~3行目:各種ライブラリをインポート。opencvを使っていますね。
- 5行目:リサイズ後の画像の高さ
- 6行目:リサイズ後の画像の幅
- 8行目:リサイズと表示
- 9行目:画像データの高さと、幅
- 10行目:縦長画像ならば
- 11行目:画像をリサイズ。幅を480pixにして、高さは縦横比を変えないように調整
- 12行目:横長なら
- 13行目:高さを480pixにして、幅は縦横比を変えないように調整。
- 14行目:画像表示。面倒なんで、cv2で表示。
- 19行目:画像データをcv2形式で読み込みます。辞書形式で格納
- 20行目:画像の辞書をfor文で回して
- 21行目:画像名を表示して
- 22行目:画像をリサイズして、表示
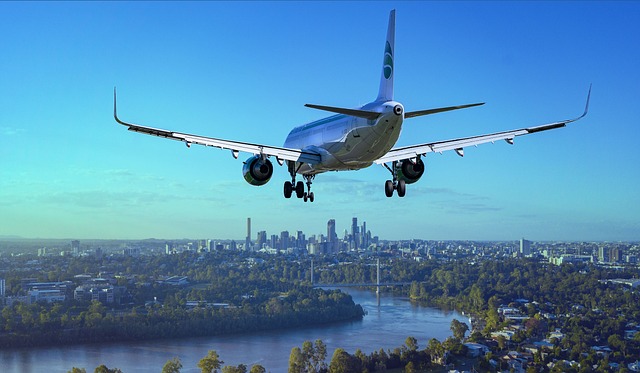
今回試すのはこんな画像です
推論と結果表示
# STEP 1: Import the necessary modules.
import mediapipe as mp
from mediapipe.tasks import python
from mediapipe.tasks.python.components import processors
from mediapipe.tasks.python import vision

# STEP 2: Create an ImageClassifier object.
base_options = python.BaseOptions(model_asset_path='classifier.tflite')
options = vision.ImageClassifierOptions(
    base_options=base_options, max_results=4)
classifier = vision.ImageClassifier.create_from_options(options)

images = []
predictions = []
for image_name in IMAGE_FILENAMES:
  # STEP 3: Load the input image.
  image = mp.Image.create_from_file(image_name)

  # STEP 4: Classify the input image.
  classification_result = classifier.classify(image)

  # STEP 5: Process the classification result. In this case, visualize it.
  images.append(image)
  top_category = classification_result.classifications[0].categories[0]
  predictions.append(f"{top_category.category_name} ({top_category.score:.2f})")

display_batch_of_images(images, predictions)- 2~5行目:メディアパイプの必要なモジュールをインポートします。
- 8行目:モデルの設定です。モデルのファイルを指定します。
- 9行目:ここも、モデル設定です。引数で8行目で指定したモデルと、max_resultsを与えています。max_resultsは予測結果の上位いくつまでを結果として返すかです。
- 11行目:予測モデルのオブジェクトを作成しています
- 13行目:画像をためる空のリスト
- 14行目:結果をためる空のリスト
- 15行目:画像のパスが入っているリストから、画像パスを1個づつ取り出してfor分回します。
- 17行目:画像を読み込みます。
- 20行目:予測モデルに画像を入力して、分類結果を出します
- 23行目:画像データはリストにためておいて
- 24行目:分類結果のtop1をとりだして。(9行目で、top4出力にするのはなぜでしょうね?。。。)
- 25行目:分類結果とリストにためておきます。
- 27行目:画像と、分類結果を表示します。上のほうで作成した自作関数をつかって。
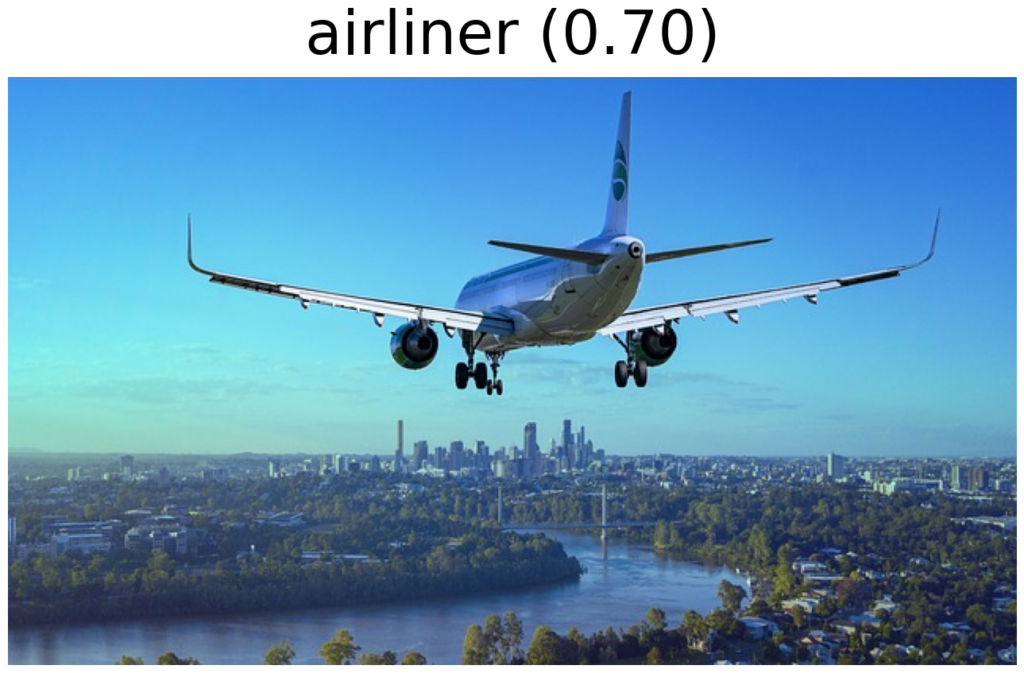
手持ちデータでためした結果はこれです。
大型飛行機と間違いなく分類できてますね。
まとめ
PC、スマホ、カメラなどと連携しやすい、Mediapipeの画像認識サンプルコードの解説をしました。初心しゃの方は、途中の関数などわかりにくいと思いますが、そこは飛ばして、Mediapipeを使って実際に手持ち画像を分類してみましょう。
tensroflowやpytorchと比べると簡単かと思いますので、これから主流になるかもしれません。ぜひ、身に着けてください。