ランダムフォレストは、機械学習の回帰・分類のアルゴリズムとして、実装の手軽さから、非常に人気があります。
ランダムフォレストはモデル作成以外に、特徴量の重要度算出という、すばらしい機能を備えています。
初心者の方にとっては、実装時に少し悩むこともありますので、特徴量の算出方法について、scikit-learnのオフィシャルページに記載されているサンプルコードを使って日本語で分かりやすく説明します。

ランダムフォレスト 特徴量の重要度
ランダムフォレストは複数のツリーモデルを使って精度の高い予測モデルの構築を行う、アンサンブル学習の一つです。
そして、非常に有効な機能として、特徴量の重要度算出が行えます。
具体的な特徴量の重要度算出方法について、scikit-learnのオフィシャルページに記載されているサンプルコードを用いて、初心者向けに日本語で分かりやすく説明します。
サンプルコードのオリジナルこちらです↓↓↓
サンプルコード解説
1.データ作成
"""
データセットを作る 乱数で適当に
"""

from sklearn.datasets import make_classification
from sklearn.model_selection import train_test_split

X, y = make_classification(
    n_samples=1000,
    n_features=10,
    n_informative=3,
    n_redundant=0,
    n_repeated=0,
    n_classes=2,
    random_state=0,
    shuffle=False,
)
X_train, X_test, y_train, y_test = train_test_split(X, y, stratify=y, random_state=42)
sikit-learnのmake_classificationを使ってデータを作成します。
特徴量は、10種類でそれぞれ1000データ、予測対象のクラスは2分類(0か1)が1000データとなります。
引数は下記です。ここは本題ではないので、軽く読み飛ばしてください。
- n_sample :データ数
- n_features :特徴量の数
- n_informative :相関の強い特徴量の数
- n_redundant:線形結合になる特徴量の数
- n_repeated:重複した特徴量の数
- n_classes:クラス数(予測対象として分類するクラスの数)
- random_state:乱数seed
- shuffle :Falseでラベルがならぶ、Trueでランダム
つづけてscikit-learnのtrain_test_splitでデータを、学習データと、検証データに分けます。
学習
"""
ランダムフォレストで学習
"""
from sklearn.ensemble import RandomForestClassifier

feature_names = [f"feature {i}" for i in range(X.shape[1])]
forest = RandomForestClassifier(random_state=0)
forest.fit(X_train, y_train)
featrue_nameは特徴量の名前のリストを作成しています。ここはあまり気になさらず。
RandomForestClassifierでオブジェクトを作成しておいて、fitメソッドで学習データを使って学習します。ここは2行で済みます。引数の説明はまた別の機会に。
重要度算出 その1
"""
特徴量の重要度を計算する
"""
import time
import numpy as np

start_time = time.time()
importances = forest.feature_importances_
std = np.std([tree.feature_importances_ for tree in forest.estimators_], axis=0)
elapsed_time = time.time() - start_time

print(f"Elapsed time to compute the importances: {elapsed_time:.3f} seconds")
重要度は、forest.feature_importances_ で簡単に取り出せます。
stdが少しわかりにくいですが、ランダムフォレストを構成している複数のツリーモデル、それぞれの重要度から、重要度の標準偏差を算出しています。重要度のばらつきと思ってください。
time関数を使って、時間を計測していますが、気にしないでおきましょう。
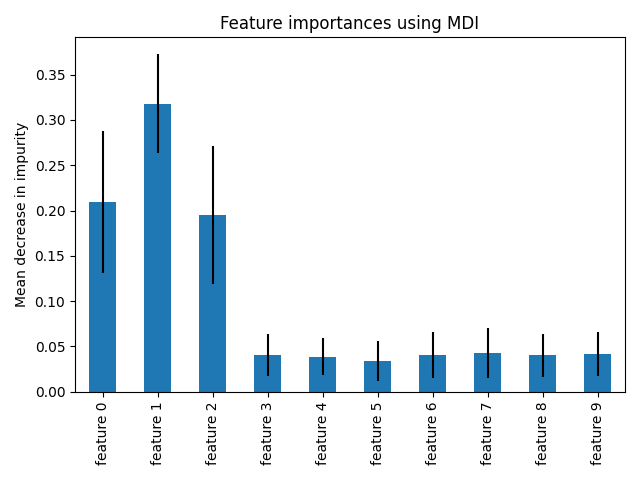
重要度のグラフ表示
import pandas as pd
from matplotlib import pyplot as plt

forest_importances = pd.Series(importances, index=feature_names)

fig, ax = plt.subplots()
forest_importances.plot.bar(yerr=std, ax=ax)
ax.set_title("Feature importances using MDI")
ax.set_ylabel("Mean decrease in impurity")
fig.tight_layout()
plt.show()
重要度をpandasのSeries形式に変換して、matplotで重要度の棒グラフを表示します。
引数 yerrにstdを入れることで、重要度のばらつきをエラーバーで表示します。
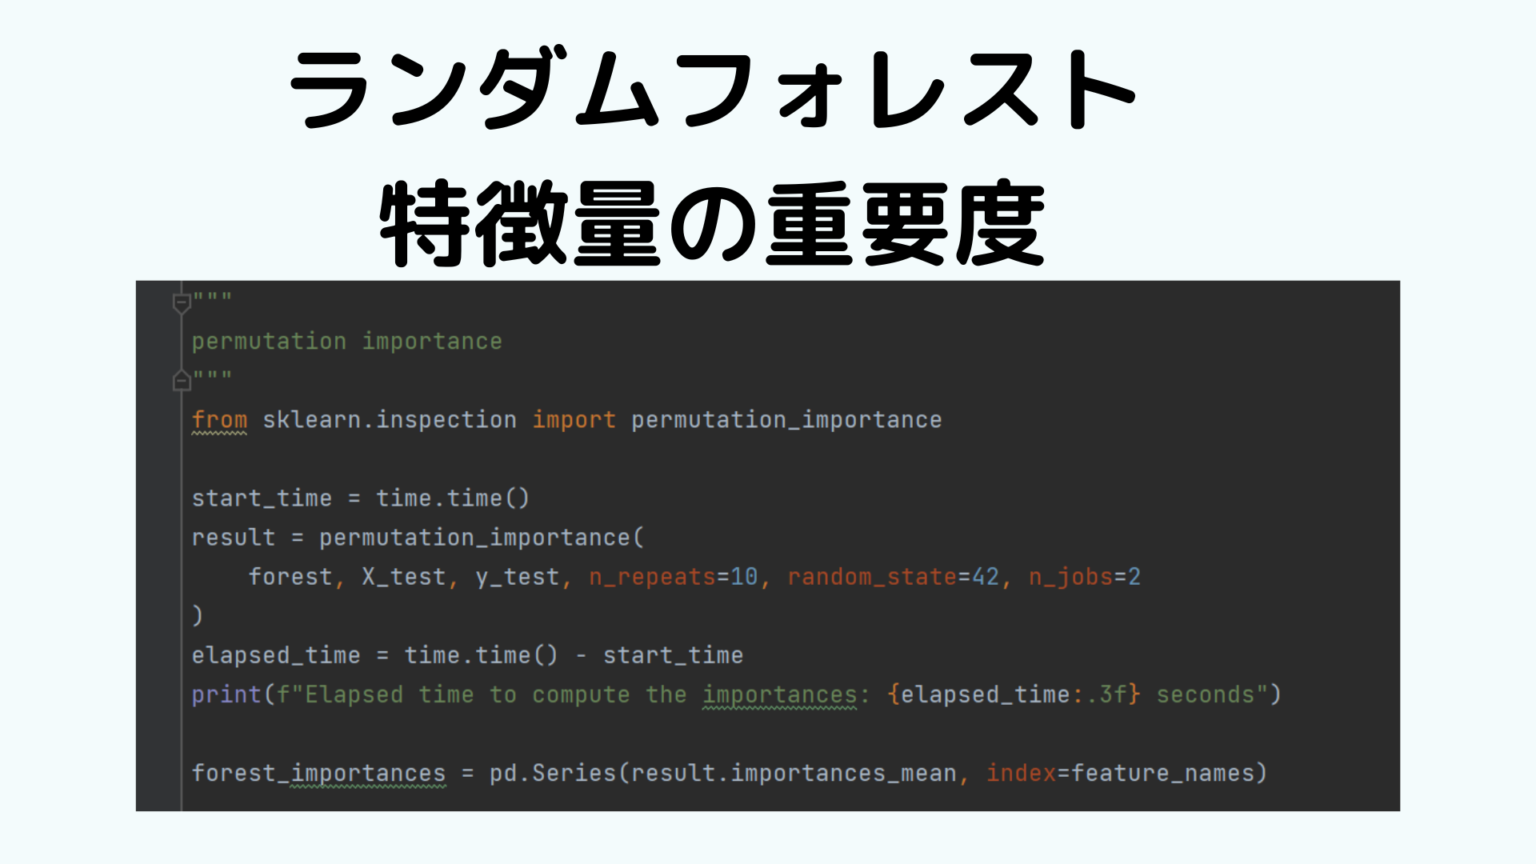
重要度 その2 permutation_importance
from sklearn.inspection import permutation_importance

start_time = time.time()
result = permutation_importance(
    forest, X_test, y_test, n_repeats=10, random_state=42, n_jobs=2
)
elapsed_time = time.time() - start_time
print(f"Elapsed time to compute the importances: {elapsed_time:.3f} seconds")

forest_importances = pd.Series(result.importances_mean, index=feature_names)
重要度を、permutation_importanceという手法で算出します。
こちらの方が、ノイズが減るようです。
sikit-learnの perrmutation_importanceという関数を使います。引数は下記です。
- estimator :モデルオブジェクト
- X:特徴量
- y:ラベル
- n_repeats:重要度を計算するときに計算する回数
- random_state:乱数seed
- n_jobs:並列計算の数
ここで、大事なのは初めの3つです。残りは初期値でも構いません。
ランダムフォレストのモデルオブジェクトと、特徴量、ラベルを指定します。
重要度 その2 permutation_importance のグラフ表示
fig, ax = plt.subplots()
forest_importances.plot.bar(yerr=result.importances_std, ax=ax)
ax.set_title("Feature importances using permutation on full model")
ax.set_ylabel("Mean accuracy decrease")
fig.tight_layout()
plt.show()
permutation importanceで計算した重要度を表示します。書き方は1回目と同じです。
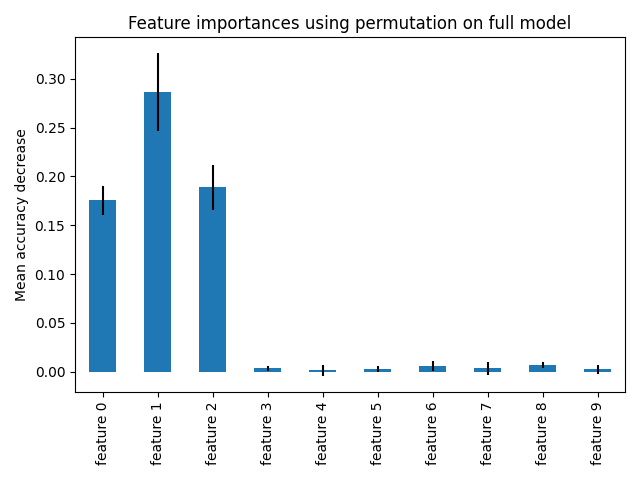
permutationで計算した重要度はノイズが減っているのがよくわかります。
データセット作成時に相関のある特徴量を3つにしているので、重要度が高い特徴量は3つですね。
まとめ
初心者の皆さん向けに、ランダムフォレストの重要度を算出プログラムの説明をしました。
重要度算出機能は、データ分析の時に、非常に有効なケースもありますので、ぜひ身に着けてください。
たとえば、1000個の特徴量から、ざっくり、100個選びたいなんてときにも有効です。